.
The Layered Grid — Forensic Infrastructure Analysis
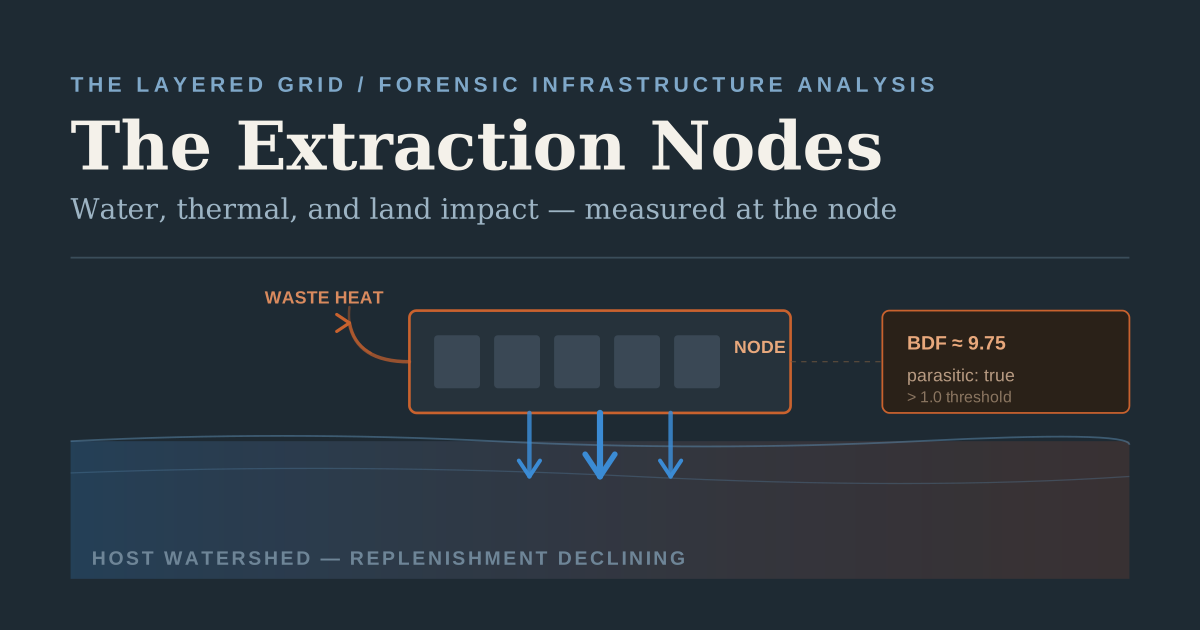
The Extraction Nodes
What Hyperscale AI Infrastructure Is Actually Doing to Land, Water, and Coastal Ecosystems
A spatial and forensic audit of the physical-resource footprint of data center expansion — water, thermal, land, and aquatic-ecological impact — across twelve jurisdictions on four continents. The analysis deliberately sets aside carbon accounting to examine the impacts that operate beneath it.
Executive Summary
The central finding of this audit is a measurement failure, not an emissions failure. The infrastructure marketed as “hyperscale efficiency” is governed by a reporting framework — carbon-denominated, globally aggregated, offset-permissive — that was never designed to detect what these facilities do to the watersheds, airsheds, and coastal ecosystems that host them. The result is a class of industrial site whose most consequential physical impacts are, by the structure of the prevailing accounting, invisible. This document makes those impacts visible.
Four observations anchor the analysis. First, location is not random. Approximately two-thirds of data centers built since 2022 sit in regions classified as high or extremely high water stress.1 This is the predictable output of a siting logic that optimises for cheap land, low-cost power, and favourable tax treatment — conditions that concentrate in precisely the arid geographies where water is already a constraint. The Amazon cluster in Spain’s Aragon region operates against a basin that has lost roughly 30% of its mean annual flow since the 1960s,2 in a country where 74% of territory is at desertification risk.3
Second, the prevailing metrics measure the wrong thing. Power Usage Effectiveness and Water Usage Effectiveness are efficiency ratios; they improve even as absolute extraction rises, because total deployed capacity is growing faster than per-unit efficiency. This is the Jevons paradox applied to digital infrastructure. To distinguish genuine infrastructure from parasitic extraction requires a metric that measures the node’s relationship to its host watershed directly. This document specifies one: the Biological Depletion Factor (BDF), a node-level ratio of energy-driven consumptive water demand to locally available renewable supply after environmental-flow reservation. A facility above BDF 1.0 consumes water faster than its watershed can replace it.
Third, the thermal vector is the least documented and least regulated of all. Only one peer-reviewed field measurement of data center atmospheric thermal impact exists anywhere in the literature.4 Atmospheric heat rejection from air-cooled facilities is unregulated in every jurisdiction on earth — no permits, no limits, no monitoring. As AI rack densities force the transition from evaporative to direct liquid cooling, the dominant thermal pathway shifts from a partially-regulated water-based system to a completely unregulated air-based one. The reported efficiency number improves; the impact moves to a pathway nobody is measuring.
Fourth, the ecological thresholds are lower than the regulatory limits. Documented fish mortality begins at a sustained temperature rise of 1.0°C; coral bleaching at 0.5–1.5°C; thermal stratification in enclosed water bodies at 1.5°C.5 Each of these sits below the 3°C discharge limit applied across most jurisdictions and the 5–7°C marine guidance set decades ago for power plants. Those limits were calibrated against a thermal baseline that no longer exists. No commercial seawater-cooled data center has published independent thermal monitoring — not one, anywhere, including facilities operating since 2011.
The gap between what is being built and what is being measured is widening faster than the regulatory frameworks are moving. The unknown is not benign.
The closing section addresses the mechanism that keeps all of this beneath public scrutiny: a transnational architecture of non-disclosure agreements between operators and host governments that systematically conceals water, thermal, and land impacts until litigation or investigative reporting forces disclosure — at which point the revealed figures have consistently exceeded what was publicly assumed.
1. The Geographic Pattern: Extraction Is Sited, Not Scattered
In December 2024, Amazon submitted a request to increase water consumption at its three data centers in Aragon, Spain, by 48%. The application was filed during the Christmas period. The justification offered was climate change: the company argued that rising temperatures and more frequent heat waves would require additional cooling water.2 The basin receiving that request — the Ebro — has lost approximately 30% of its mean annual flow since the 1960s.6 The region surrounding it has 74% of its territory at risk of desertification, with 20% already classified as irreversibly desertified.3 Amazon’s existing licence already authorises 755,720 cubic metres per year, drawn from a basin in which agriculture consumes more than 90% of total available water.2 The request was not an aberration. It was the logical extension of a siting pattern that has been consistent, global, and structurally invisible to every measurement framework the industry currently uses.
1.1 The Structural Logic of Water-Stressed Siting
Approximately two-thirds of data centers built since 2022 are located in regions classified as high or extremely high water stress.1 The mainstream framing treats this as an unfortunate coincidence — the industry growing faster than its environmental planning. It is not a coincidence. It is the predictable output of a site-selection logic that optimises for three variables: inexpensive land, low-cost electricity, and favourable tax treatment. Those three conditions concentrate disproportionately in arid and semi-arid geographies, precisely because chronic water scarcity has historically suppressed competing industrial and agricultural demand, leaving land cheap and power infrastructure underutilised.
The consequence is a spatial mismatch between water demand and water availability that is embedded in the industry’s growth pattern rather than incidental to it. A facility does not arrive in a water-stressed basin despite the stress. It arrives because the same conditions that produce the stress — low precipitation, high solar irradiance, flat terrain, sparse prior development — also produce the cost profile that makes the site economically attractive. Verisk Maplecroft categorises 52% of global data center hubs as facing high or very high water-stress risk by 2030, rising to 58% by 2050 under a high-emissions scenario.7 An MSCI analysis of roughly 14,000 data center assets finds that about one in four existing facilities may experience more frequent water-scarcity days by 2050, and that roughly 30% of projects currently under construction sit in regions where scarcity is expected to intensify.8
1.2 Aragon: The “Virginia of Europe” and the Arithmetic of Rainfall
The Aragon corridor illustrates the logic with unusual clarity, because its own promoters have supplied the metaphor that exposes it. Jorge Azcón, Aragon’s president, has marketed the region as “the Virginia of Europe” — a phrase intended to signal that Aragon has arrived as a serious data center destination on par with the world’s largest hub. The comparison collapses on a single data point.
Against that rainfall deficit, the region has assembled one of the densest pipelines of announced data center investment in Europe. The combined commitments now approach €70 billion, spanning AWS, Microsoft, Blackstone/QTS, Forestalia, and a tail of smaller projects.9 AWS’s three Aragon campuses alone are projected to consume more electricity than the entire Aragon region currently uses across all households, infrastructure, and industry combined — more than 10,000 GWh annually.9 The peer-reviewed assessment by Torrubia et al. (2026), published in Energy Policy, finds that all data centers announced in Aragon up to August 2025 could require approximately 10 million cubic metres of water per year, and that under baseline scenarios consumption could reach 4.6–7.3 cubic hectometres by 2035, rising to 11–33 hm³ if green-hydrogen co-location proceeds.10 That upper bound represents a 41–124% increase relative to Aragon’s entire current economic-sector water consumption.10 The Aragon government’s public response has been that the impact is “imperceptible.”10 The peer-reviewed projection and the government characterisation cannot both be correct.
1.3 Phoenix: The Regulatory Asymmetry Made Explicit
Where Aragon demonstrates the rainfall arithmetic, Phoenix demonstrates the regulatory asymmetry that allows the pattern to proceed even where water governance is mature. The Phoenix Active Management Area is currently in overdraft by approximately 251,000 acre-feet annually.11 This is the baseline condition — the deficit that exists before the projected expansion. Ceres analysis finds that data centers around Phoenix currently consume roughly 385 million gallons per year for direct cooling, with planned facilities projected to push that to 3.7 billion gallons — an 870% increase, and nearly twice the water required to supply the city of Flagstaff.12
The asymmetry is the analytically important part. Arizona’s 1980 Groundwater Management Act requires new residential developments in Active Management Areas to demonstrate an assured 100-year water supply. In 2023, the state imposed a moratorium on new housing developments in parts of the Phoenix metropolitan area that rely on groundwater. Neither the 100-year requirement nor the moratorium applies to industrial development, including data centers.11 The Tract complex in Buckeye — a 2,069-acre parcel that could house up to 40 facilities and reach 9 gigawatts of demand — intends to self-supply by drilling on-site wells, constrained only by a planning-document cap of 2,000 acre-feet per year.11
1.4 The Land-Price Feedback Loop
The siting pattern does not merely consume water; it restructures the economics of the land around it, and that restructuring is self-accelerating. A data center land acquisition inflates adjacent parcel values. Remaining farmers face rising property-tax assessments and intensifying water competition. Farming becomes uneconomic at the margin. More land sells to developers. Prices inflate further. The documented multipliers across US markets are not modest.
| Market | Agricultural baseline ($/acre) | DC-zoned price ($/acre) | Multiplier |
|---|---|---|---|
| Columbus, Ohio | ~30,000 | ~150,000 | 5× |
| Salt Lake City, Utah | ~50,000 | ~400,000 | 8× |
| Bexar County, Texas | Ranchland baseline | 10× ranchland | 10× |
| Prince William County, VA (Devlin) | ~190,000 | 3,700,000 | 19.5× |
Table 1. Land-price multipliers near US data center corridors, 2024–2025. Source tier: Industry / investigative journalism. Ref. 13.
The Prince William County case is the clearest documented instance of the speculative incentive at work. Stanley Martin Homes assembled the 270-acre Devlin Technology Park site for $51.3 million over 2021–2022, then sold 188.5 acres of it to Amazon Data Services for $700 million in November 2025 — a 13.6× return in roughly three years, and the largest undeveloped land deal in Virginia history at $3.7 million per acre.13 The American Farm Bureau Federation has identified the propagation mechanism: through IRS Section 1031 like-kind exchanges, landowners defer capital-gains tax by reinvesting farmland-sale proceeds into farmland elsewhere, pushing up values in destination markets and carrying the speculative premium outward from the original corridor.14 Developers prefer agricultural land precisely because it arrives already cleared, graded, and assembled in large contiguous tracts — lowering their upfront cost while removing the most productive land from cultivation.
1.5 The Employment Inversion
The standard economic-development case for hosting these facilities rests on jobs. The case does not survive contact with the operational data. Facilities occupying 40 to 1,000 acres typically employ fewer than 150 permanent workers each.15 Meta’s 2,250-acre Richland Parish facility in Louisiana — potentially the largest in the Western Hemisphere, at a projected $10–30 billion investment — projects approximately 500 permanent jobs against 5,000 construction jobs at peak.16 The University of Madrid analysis of the regional effect found that data center demand had multiplied industrial land prices up to fivefold in under a decade, pushing genuine manufacturing — the employment-dense land use — toward more remote locations with worse connectivity.17
This is the green-employment paradox: “green” digital infrastructure prices out employment-generating land use while delivering negligible permanent employment of its own. The land is not converted from idle to productive. It is converted from productive to extractive.
This is the geographic pattern in full: facilities sited by an economic logic that systematically selects water-stressed land, governed by regulatory regimes that constrain housing but exempt industry, generating land-price dynamics that displace the agriculture and manufacturing they replace, and justified by employment figures that the operational record does not support. What follows is the instrument required to measure its hydrological consequence directly.
2. The Biological Depletion Factor: A Node-Level Diagnostic
Industry metrics normalise impact against computational output, which erases absolute extraction from the ledger. Power Usage Effectiveness (PUE) measures energy overhead per unit of compute; Water Usage Effectiveness (WUE) measures litres evaporated per kilowatt-hour. Both have improved dramatically — the US industry-average WUE fell from roughly 1.8 L/kWh in 2021 to 0.36 L/kWh by 2024.18 And yet absolute water consumption has risen across the same period, because total deployed capacity is growing faster than per-unit efficiency improves. Google’s data center water consumption rose approximately 20% from 2021 to 2022 and a further 17% the following year; Microsoft’s rose 34% and then 22%.19 This is the Jevons paradox in its digital form: efficiency gains per unit of output are swamped by the expansion of total output. An efficiency ratio cannot, even in principle, detect this. A different instrument is required.
2.1 Definition and Formula
The Biological Depletion Factor (BDF) inverts the logic of the efficiency metrics. It asks a single question of each node: does the host ecosystem replenish water faster than the node consumes it? If not, the node is parasitic — it is mining a renewable resource into depletion. The metric is a ratio.
where the numerator is total energy-driven consumptive water demand and the denominator is locally available renewable supply after environmental-flow reservation. Each term is publicly queryable, a deliberate design choice intended to resist the disclosure opacity documented in Section 5.
| Term | Symbol | Definition and basis |
|---|---|---|
| Direct consumptive water | Wᵈ | On-site evaporative cooling withdrawal × consumptive ratio (0.70–0.90). 70–80% of withdrawn water is lost permanently to atmospheric evaporation. |
| Indirect electricity water | Wⁱ | Water consumed in power generation serving the facility; US average 7.1 m³/MWh, with indirect-to-direct ratio of ~12:1 for mixed-grid electricity (LBNL). |
| Local renewable supply | R | Annual renewable freshwater — runoff plus groundwater recharge — via WRI Aqueduct. |
| Environmental-flow reserve | E | Water reserved for ecological integrity; the Richter et al. presumptive standard of 80% of daily flow. |
Table 2. BDF component definitions. Source tier: Academic (Siddik et al.; LBNL; Richter et al.) / Industry data (WRI Aqueduct). Refs. 18, 20, 21.
A value above 1.0 means the node’s energy-driven consumption exceeds the watershed’s renewable supply after ecological protection has been reserved. The threshold is not arbitrary. It rests on two established standards: the freshwater planetary boundary, assessed as transgressed as of 2022,22 and the Richter et al. presumptive 80%-of-daily-flow protection standard.21 As hydrologist Newsha Ajami has observed, data centers function as “permanent crops” that demand continuous water regardless of drought conditions.23 Above BDF 1.0, that permanence becomes lethal to the host.
2.2 The Classification Bands
| BDF band | Class | Ecological state | IIIP flag |
|---|---|---|---|
| < 0.2 | Sustainable | Within 20% of replenishment; flows protected | parasitic: false |
| 0.2 – 0.4 | Low depletion | Noticeable draw; competing uses pressured | parasitic: false |
| 0.4 – 0.8 | High depletion | Flows compromised; stress rising | parasitic: false |
| 0.8 – 1.0 | Critical depletion | 80–100% of replenishment consumed | parasitic: false |
| > 1.0 | Parasitic drain | Consumption exceeds supply; permanent damage | parasitic: true |
Table 3. BDF classification matrix. The black band (> 1.0) is a discontinuity, not a continuation of the gradient: above it, the node consumes the resource faster than it regenerates.
2.3 Worked Example: A 50 MW Facility in a Stressed Basin
The calculation is deliberately transparent. Consider a 50 MW facility in a water-stressed basin. At 8,760 operating hours, annual energy is 438,000 MWh. Direct cooling water is on the order of 657,000 m³/year. Applying the LBNL indirect multiplier of approximately 12× yields indirect water of 7,884,000 m³/year, for a total consumptive footprint of 8,541,000 m³/year. If the gross renewable supply of the watershed is 5,000,000 m³/year and the environmental-flow reserve takes 80% of that, the effective replenishment available for new industrial use is 1,000,000 m³/year.
A single 50 MW facility consumes 8.5 times the renewable water available in its watershed after ecological protections are honoured. The instrument is engineered for automated screening: it ingests five inputs — Wᵈ, Wⁱ, R, E, and geolocation — and emits a BDF value, a classification band, and a parasitic true/false flag. A water authority with USGS and EIA data can compute the BDF of a proposed facility in roughly thirty minutes, and decline permits for nodes above 1.0 before they are built rather than after.
2.4 Empirical Application: The Amazon–Aragon Node
Applied to the Aragon cluster, the metric produces a result that places the node far beyond the parasitic threshold. For the three AWS facilities, estimated energy consumption of approximately 800,000 MWh/year at a WUE of 1.5 L/kWh yields roughly 1.2 million m³/year of direct consumption. Applying the LBNL indirect multiplier of approximately 12× gives indirect consumption of roughly 14.4 million m³/year, for a total consumptive footprint of approximately 15.6 million m³/year. The Ebro basin’s Aragon zone, after environmental-flow requirements and existing agricultural allocation exceeding 90% of basin water, retains an estimated 1.6 million m³/year of available replenishment for new industrial use.10
| Parameter | Value | Method |
|---|---|---|
| Estimated energy (3 facilities) | ~800,000 MWh/yr | Disclosed MW scaling |
| Direct water consumption | ~1.2M m³/yr | WUE 1.5 L/kWh |
| Indirect multiplier | 12× direct | LBNL national average |
| Indirect water consumption | ~14.4M m³/yr | Mixed grid-mix ratio |
| Total consumptive footprint | ~15.6M m³/yr | Direct + indirect |
| Available replenishment (residual) | ~1.6M m³/yr | Ebro Aragon zone, post-allocation |
| BDF quotient | ~9.75 | Extreme parasitic drain |
Table 4. BDF calculation for the Amazon–Aragon node. Inputs are estimates derived from disclosed capacity and peer-reviewed basin figures; see the methodological flag below. Refs. 10, 20.
A BDF of approximately 9.75 means the node consumes water at nearly ten times the Ebro basin’s Aragon-zone replenishment rate. Every cubic metre drawn represents nearly ten cubic metres the watershed cannot replace within the same period.
2.5 Why the Sustainability Claims Do Not Address the Finding
Amazon frames the Aragon expansion as environmental leadership: 100% renewable-energy matching since 2022, a commitment to be “water positive by 2030,” and €17.2 million in local water projects. The BDF result does not refute these claims. It renders them non-responsive. “100% renewable matching” through power-purchase agreements does not eliminate indirect water consumption; it relocates the accounting, not the evaporation. “Water positive by 2030” is a global accounting claim that cannot alter local hydrology — the Ebro basin loses approximately 15.6 million m³ to three buildings whether or not an equivalent volume is restored in a different watershed on a different continent. And the €17.2 million water investment equals roughly 0.05% of Amazon’s €33.7 billion regional commitment.
The claims are not false. They measure something else entirely. The measurement framework in use was never designed to capture the relationship between a node and its host watershed — which is exactly why a node at BDF 9.75 can be certified as approaching “water positive.”
3. The Thermal Vector: The Unmeasured Discharge
Nearly every watt a server consumes is converted to waste heat. A facility drawing one gigawatt does not make that energy disappear; it rejects it — into air, into water, or into soil. Thermal discharge is therefore not a side effect of data center operation but its inevitable physical output, scaled to the power draw. It is also the least documented and least regulated of every pathway examined in this audit. The disparity is itself the finding: the dominance of carbon accounting in environmental discourse has produced a systematic blind spot, in which the heat these facilities pour into their surroundings is neither metered nor permitted nor capped, anywhere.
3.1 The Only Field Measurement That Exists
In May 2026, researchers at Arizona State University led by David Sailor published the first — and, at the time of writing, the only — peer-reviewed study that directly measured air-temperature changes downwind of operating data centers. The team deployed vehicle-mounted high-accuracy temperature sensors around four Phoenix-area facilities from June through October 2025, sampling at two-second intervals at pedestrian height, with simultaneous upwind and downwind measurement to control for ambient variation.4 The findings were unambiguous.
| Measured quantity | Finding |
|---|---|
| Downwind air-temperature rise (mean) | 1.3–1.6°F (0.7–0.9°C) above upwind baseline |
| Downwind air-temperature rise (peak) | Up to 4.0°F (2.2°C) above upwind baseline |
| Thermal plume detection distance | Up to ~500 m (≈ five city blocks) from facility perimeter |
| Condenser exhaust temperature | 14–25°F (7.8–13.9°C) above ambient |
| Heat-flux density at facility | 2,000–6,000 W/m² — 2–6× peak solar irradiance |
| 169 MW campus heat-rejection equivalent | Waste heat of ~200,000 households on a few hundred parcels |
Table 5. ASU/Sailor field-measurement findings, four air-cooled Phoenix facilities, June–October 2025. Source tier: Academic, peer-reviewed. Ref. 4.
The heat-flux figure is the one that reframes the problem. A discharge of 2,000–6,000 W/m² is two to six times peak solar irradiance — the facility is, in thermal terms, a denser heat source than the desert sun at midday, concentrated onto a footprint of a few hundred residential parcels.4 Epidemiological literature indicates that each 1°F rise during a heat wave raises all-cause mortality risk by approximately 2.5%, and that all-cause mortality runs 9–10% higher during hot nights — the precise condition a 24/7 facility produces.24
A separate satellite study, posted in March 2026, claimed approximately 2°C land-surface-temperature increases at data center locations worldwide, with effects extending up to 10 kilometres. It received wide media attention before methodological criticism rendered it non-credible: it conflated land-cover change with operational heat discharge — a dark roof reads hotter than the vegetation it replaced regardless of whether the servers are running — used no control group, and posited a 10-kilometre radius of influence that is physically implausible for waste-heat dissipation.25 This audit relies on the credible measurement and sets the discredited one aside, noting it only to mark the boundary of what the evidence currently supports.
3.2 The Scale of Aggregate Thermal Output
Because nearly 100% of IT electricity becomes heat, total thermal rejection can be derived from electricity consumption and PUE with reasonable confidence. A facility at PUE 1.15 with a 1 GW IT load rejects approximately 1,150 MW of continuous heat. To contextualise: a 1 GW campus draws continuous power equivalent to roughly 800,000–940,000 US homes, representing about 20% of New York City’s entire electricity consumption, and its thermal output is comparable to a medium-sized nuclear plant — concentrated into a vastly smaller footprint.26
At the aggregate scale, the International Energy Agency projects global data center electricity consumption rising from approximately 415 TWh in 2024 to approximately 945 TWh by 2030 in its base case.27 The IEA itself notes that reused data center heat could theoretically supply roughly 300 TWh of European heating demand — about 10% of EU space heating — yet current actual recovery is estimated at under 1 TWh globally, less than 0.1% of theoretical potential.27
3.3 The Regulatory Void and the Cooling-Architecture Shift
Atmospheric thermal discharge from air-cooled data centers faces no regulation in any jurisdiction. No discharge permits, no temperature limits, no monitoring mandates, no reporting requirements. This is not because regulators judged the discharge acceptable; it is because environmental frameworks were built around two categories — effluent to water (the Clean Water Act, the EU Water Framework Directive) and air pollutants (the Clean Air Act). Sensible heat carried by air currents is neither. It falls between the frameworks, and so escapes both.
This void is about to widen, because the cooling architecture is changing. AI rack densities are forcing the transition from air cooling to direct liquid cooling: the NVIDIA GB200 NVL72 draws 120–140 kW per rack, a density at which traditional air cooling becomes physically impractical, and the forthcoming Rubin platform is projected at 250–900 kW per rack.28 Evaporative cooling rejects heat as latent heat in water vapour, and is at least partially regulated. Direct liquid cooling rejects heat as sensible heat, a temperature rise in air or secondary liquid, which is unregulated everywhere.
The liquid-cooling transition improves the reported efficiency number while redirecting the thermal impact onto a pathway with zero regulatory coverage. The metric gets better. The physics gets worse. No framework registers the move.
Germany’s Energy Efficiency Act, mandating 10–20% heat recovery on a 2026–2028 schedule for facilities above 300 kW, is the only operational regulatory template anywhere that treats unrecovered waste heat as a regulated externality rather than a free disposal.29
3.4 The Triple Thermal Convergence
The thermal vector reaches its sharpest expression in the desert Southwest, where three warming sources compound in the same geography. Phoenix is projected to experience approximately 47 days per year above 110°F by 2050, against roughly 7 such days in 1990 — that is climate-driven warming, the first layer.30 The urban heat-island effect adds a second. Data center waste heat adds a third: Salt River Project reports that data centers contributed 5.1% of summer 2025 peak demand, up 425% in six years, and the ASU study’s 1.3–4.0°F of additional localised warming stacks directly on top of the climate and heat-island layers in the same airshed.4 The combination — unregulated sensible-heat discharge, exempted groundwater extraction, and three compounding thermal layers — makes the desert Southwest the highest-risk region in the world for cumulative thermal impact from AI infrastructure, and it is being assembled with no thermal monitoring regime capable of detecting the cumulative effect until after it has arrived.
4. The Coastal Threshold: Where the Margin for Error Is a Fraction of a Degree
The preceding sections documented impacts that are happening now, at named facilities, with quantified consequences. This section addresses where the pattern leads if it continues into coastal and marine cooling at scale — and it requires a different evidential discipline, because the direct data does not yet exist. There is no peer-reviewed ecological study of thermal discharge from any commercial seawater-cooled data center, anywhere. Every conclusion that follows rests on power-plant proxy data and on documented ecological thresholds. The honest framing is therefore not that marine damage from data centers has been measured, but that the conditions for it are being assembled in the absence of any monitoring regime capable of detecting it. That distinction is the entire argument.
4.1 The Thresholds Are Lower Than the Limits
The decisive fact about aquatic thermal impact is that biological disruption begins well below the temperature increases that regulation permits. Controlled experiments simulating coastal power-plant discharge found 10% mortality in silvery pomfret at a sustained 1.0°C rise under summer conditions, rising to 38.9% at higher sustained increments.5 Hermatypic coral bleaches and suffers 90–95% mortality from seawater-temperature increases of just 0.5–1.5°C sustained over weeks.5 Temperature increases exceeding 1.5°C can induce thermal stratification in enclosed and semi-enclosed water bodies, weakening the vertical mixing that carries nutrients to the photic zone and oxygen to depth.31 Each of these thresholds sits beneath the regulatory ceilings.
| Organism / process | Disruption threshold | Outcome |
|---|---|---|
| Silvery pomfret (fish) | 1.0°C sustained | 10% mortality (summer); 38.9% at higher increments |
| Hermatypic coral | 0.5–1.5°C over weeks | 90–95% mortality / bleaching |
| Enclosed-sea water column | 1.5°C | Stratification; vertical nutrient mixing disrupted |
| Marine benthos (general) | 4.38°C mean near outlets | Biodiversity decline; community-structure shift |
| Regulatory limit (most US states) | 3.0°C | Permitted discharge ΔT |
| GESAMP marine guidance | 5–7°C | Recommended ceiling (set for power plants) |
Table 6. Documented ecological disruption thresholds against prevailing regulatory limits. The biological thresholds sit below the regulatory ceilings. Source tier: Academic, peer-reviewed; international guidance. Refs. 5, 31.
4.2 The Baseline Has Already Moved
The thresholds matter because the receiving waters are not starting from a neutral baseline. They are already warming, and already stressed, before any industrial discharge is added. Irish Sea temperatures have risen approximately 0.6°C per decade since 1994.32 North Sea stratification is intensifying measurably year on year, with the northern North Sea projected toward potentially permanent stratification — a condition that would eliminate the seasonal overturning on which the entire nutrient cycle of the shelf sea depends.31 The North Sea averages roughly 90 metres deep and the Baltic roughly 55; both are among the shallowest semi-enclosed seas on the planet, and both already host dense data center clustering along their margins. The cumulative thermal loading from those combined sources has never been modelled.
4.3 What One Degree Looks Like: The Icelandic Coastal Record
The abstract threshold figures acquire their meaning in the field record, and the North Atlantic provides one of the clearest. The displacement of cold-adapted coastal species by warm-water opportunists in Icelandic waters over the past two decades is documented at the population level and is not scientifically contested. It is a worked example of what a sustained shift of roughly one degree does to a coastal community structure.
Icelandic shoreline waters historically held a cold-adapted demersal community — saithe (Pollachius virens), shorthorn sculpin (Myoxocephalus scorpius), and the associated assemblage that defined the near-shore ecology for centuries, with abundant cod and herring not far offshore. As North Atlantic surface temperatures rose by roughly a degree, Atlantic mackerel (Scomber scombrus) — a warm-water pelagic opportunist — expanded across the shoreline zone, and the cod and herring shifted progressively northward. The large cod that once defined Icelandic coastal fisheries are now concentrated in the colder waters of the northern North Atlantic. This is not a slow gradient registering at the margins. It is a community reorganisation around a new dominant species, visible within a single human lifetime.
One degree did not make the ecosystem slightly warmer. It crossed the thermal envelope that defined the community, and the entire assembly reorganised around a different dominant species. The threshold data states the number; the North Atlantic states what the number means.
The mechanism is the same one the threshold table describes. A warm-water species’ thermal envelope shifts poleward as the water warms; a cold-adapted species’ envelope contracts. Where the two cross, the community does not blend — it switches. The relevance to coastal data center cooling is direct: a facility discharging sensible heat into an already-warming, already-stratifying enclosed sea is adding a localised, continuous thermal perturbation precisely of the order — a fraction of a degree to a degree, sustained — that the field record shows is sufficient to flip a community. The data center is not the climate. But it adds to the climate signal, locally and continuously, in exactly the range where the field evidence shows community-level effects occur.
4.4 The Chemical Discharge Compounds the Thermal
Thermal load is not the only discharge from seawater cooling. Such systems require continuous chlorination to control biofouling, and the chemical pathway may be more ecologically consequential than the thermal one. At routine operational chlorine residuals of 0.1–0.3 mg/L at the discharge point, documented copepod mortality reaches 7.9% for calanoids and 21.6% for naupliar (larval) stages.33 Copepods represent roughly 70% of ocean biomass and form the essential trophic link between phytoplankton and higher predators; their naupliar stage is the critical bottleneck that sustains the entire marine food web. A 21.6% mortality rate at routine operating concentrations, applied continuously at a facility withdrawing millions of litres daily, is a chronic source of trophic disruption — and it is entirely unregulated for data center operations.
4.5 Fourteen Years, Zero Monitoring
The defining feature of the marine vector is not a body of alarming measurements. It is the absence of measurement. Google’s Hamina facility has drawn cooling water from the Gulf of Finland since 2011. Green Mountain’s Rennesøy facility draws from a Norwegian fjord. Not one of these has published independent thermal or ecological monitoring of its discharge. Microsoft’s Project Natick, the most visible submerged-data-center experiment, deployed off Orkney in 2018–2020; the operator stated that water “just metres downstream” would warm by “a few thousandths of a degree at most” — a claim never independently verified through peer-reviewed monitoring.34 Microsoft confirmed in 2024 that Natick was no longer active and never published a full Environmental Impact Assessment.
This is the forensic position in its precise form. The claim is not that coastal data center cooling is boiling the North Sea, or that any specific fishery collapse has been attributed to a data center. The claim is narrower and harder to dismiss: a system with documented sub-degree sensitivity thresholds, discharging into receiving waters whose thermal baseline has already shifted, governed by limits calibrated for a cooler era and for a different industry, is being operated with no independent monitoring at any commercial facility. The burden of demonstrating that this is safe rests with the operators who hold the monitoring data they have not published. In its absence, the precautionary reading is not alarmism; it is the only epistemically available position.
5. The Confidentiality Architecture: Why None of This Is Visible
A reasonable reader might ask why, if the impacts are as documented above, they are not already the subject of routine public scrutiny. The answer is structural. Non-disclosure agreements between data center operators and host governments function not as ordinary contractual confidentiality but as a transnational architecture of opacity that conceals water, thermal, and land impacts simultaneously — and consistently, when pierced, reveals figures larger than were publicly assumed.
In Virginia — the world’s largest data center concentration — researchers at the University of Mary Washington found that 25 of 31 localities hosting data centers operate under NDAs that block disclosure of water consumption, energy demand, and infrastructure design.35 An agreement between Spotsylvania County and Amazon explicitly classifies “water usage, sewage usage, and basis of design” as confidential information.35 The effect is not the suppression of an individual data point; it renders facility-level resource consumption literally unknowable to the public in the jurisdiction that hosts the largest concentration of these facilities on earth.
Uruguay demonstrates both that the agreements can be pierced and what lies beneath them. When campaigners sued under Article 47 of the Uruguayan Constitution — which guarantees civil-society participation in water-resource management — court-ordered disclosure revealed that Google’s “Project Teros” would consume 7.6 million litres of potable water per day, equivalent to the domestic consumption of roughly 55,000 people.36 The NDA had concealed not a marginal adjustment but an impact of municipal scale. The same disclosure revealed that the facility’s generators were specified to emit nitrogen dioxide at 17 times the legal limit.36 Uruguay was the first country in the world to declare water a human right in its constitution; it took constitutional litigation to learn how much water a single facility would take.
The pattern repeats with enough regularity across jurisdictions to be treated as structural rather than incidental — a confidentiality-to-harm pipeline: an operator requests confidentiality; the host government agrees; environmental data becomes inaccessible; impact accumulates undetected; litigation or investigative journalism eventually forces disclosure; the revealed figures exceed prior assumptions; regulatory or judicial backlash follows, by which point the facility is built and operating. Virginia’s 86% statewide water-consumption increase since 2019 surfaced only through a legislative audit.37
The NDA does not merely hide a number. It prevents cumulative impact assessment by fragmenting information across jurisdictions, vectors, and time — ensuring that no party except the operator can ever assemble the whole picture. The opacity is not a by-product of the business model. It is load-bearing.
This is why the measurement failure described throughout this audit persists. It is not only that the prevailing metrics are mis-specified — though they are — but that the facility-level data required to apply better metrics is contractually sequestered. A BDF cannot be computed from public data if the water-withdrawal figure is classified as a trade secret. A thermal-discharge limit cannot be enforced if no facility reports its rejection in megawatts. The opacity and the mis-specification reinforce each other: the wrong things are measured, and the right things are hidden.
6. Conclusion: The Instruments Do Not Yet Exist
The argument of this audit is not that hyperscale data centers are uniquely malevolent, nor that the digital infrastructure they provide is without value. It is narrower and more structural. The infrastructure is being built faster than the instruments required to measure its physical consequences, and the prevailing framework — carbon-denominated, globally aggregated, offset-permissive, and contractually opaque — was never designed to detect the consequences that matter most at the local scale where they actually land.
The siting pattern is not random: extraction concentrates in water-stressed geographies because the economics select for them. The efficiency metrics cannot detect parasitic extraction because they measure ratios while extraction is absolute; the Biological Depletion Factor is one corrective instrument, and it places the Amazon–Aragon node an order of magnitude beyond the parasitic threshold. The thermal vector is the least measured of all — one field study for an entire industry, zero regulation of atmospheric discharge anywhere, and a cooling-architecture transition that moves heat onto an unregulated pathway while improving the reported number. And the coastal threshold is governed by limits calibrated for a cooler world and a different industry, against ecological sensitivities that the North Atlantic field record shows can reorganise an entire coastal community within a single human lifetime at a shift of roughly one degree.
None of the instruments required to govern this exists at scale. There is no standardised, watershed-specific water-disclosure framework. There is no thermal-discharge metric analogous to PUE or WUE, and no atmospheric thermal regulation in any jurisdiction. There is no cumulative impact-assessment requirement for the clusters where individual facilities each pass review while collectively exhausting a shared watershed, airshed, or shallow sea. And there is no independent ecological monitoring at a single commercial seawater-cooled facility on the planet.
The gap between what is being built and what is being measured is widening faster than the regulatory frameworks are moving. Where disclosure has been forced, the revealed impacts have consistently exceeded what was assumed. The unknown is not benign — it is merely unmeasured.
The closing observation belongs to the North Atlantic, because it states the stake plainly. One degree of sustained warming reorganised the coastal species community of an entire island nation within living memory — saithe and sculpin along the shore giving way to mackerel, the cod and herring retreating north, the large cod that defined the fishery now found only in colder waters. That is what a fraction of a degree, sustained, does to a system at its threshold. The question raised by coastal and marine data center cooling is not whether such threshold effects are real; the field record settles that. The question is whether we will build the instruments to measure for them before the threshold is crossed, or after — and at present, for the most consequential vectors, we are building the facilities and declining to build the instruments at the same time.
References
Source tiers follow the forensic standard: Primary (regulatory / government) > Industry body > Academic (peer-reviewed) > Quality journalism. Figures are flagged where projected rather than measured. Several quantitative claims rest on chains of estimate (notably the Aragon BDF); these are identified in the body text and should be read as screening estimates, not measured values.
- 1. Bloomberg / Lincoln Institute of Land Policy — share of post-2022 data centers in water-stressed regions. Journalism / industry analysis. [lincolninst.edu]
- 2. Source Material — AWS Aragon water permits and December 2024 48% increase request. Journalism, drawing on regulatory filings. [source-material.org]
- 3. UPM analysis citing MITECO — desertification risk (74% of territory) and water stress. Academic / government. [blogs.upm.es]
- 4. Sailor, D. et al. (May 2026), ASME Journal of Engineering for Sustainable Buildings and Cities — first peer-reviewed field measurement of data center atmospheric thermal impact, four Phoenix facilities. Academic, peer-reviewed. [news.asu.edu]
- 5. Peer-reviewed thermal-ecology literature — fish mortality at 1.0°C sustained rise; coral bleaching at 0.5–1.5°C; systematic review of nuclear-outlet thermal effects. Academic. [nature.com]
- 6. Batalla et al. (2004), Journal of Hydrology; Gallart & Llorens (2004) — Ebro basin runoff decline (~30% since 1960s–1970s). Academic, peer-reviewed. [hal.science]
- 7. Verisk Maplecroft — data center hubs at high/very-high water-stress risk (52% by 2030, 58% by 2050). Industry risk analysis. [fortune.com]
- 8. MSCI — analysis of ~14,000 data center assets; water-scarcity exposure projections. Industry analysis. [finance-commerce.com]
- 9. Aragon investment pipeline (~€70bn); AWS electricity vs. regional consumption; AWS jobs estimate. Journalism / company disclosure. [source-material.org]
- 10. Torrubia et al. (2026), Energy Policy — cumulative Aragon data center water demand; 2035 projections; basin-share analysis. Academic, peer-reviewed. [sciencedirect.com]
- 11. Circle of Blue / Grist — Phoenix AMA overdraft (~251,000 acre-ft/yr); 1980 Groundwater Management Act asymmetry; Buckeye / Tract self-supply. Primary / journalism. [circleofblue.org]
- 12. Ceres — Phoenix data center direct cooling water (385M → 3.7B gal/yr; 870% increase). Advocacy research. [ceres.org]
- 13. DataCenters.com / CoStar / Virginia Business — land-price multipliers; Devlin Tech Park transaction ($700M / 188.5 acres). Industry / journalism. [contrarianunicus.substack.com]
- 14. American Farm Bureau Federation — Section 1031 like-kind exchange propagation of farmland-price inflation. Industry body. [ambrook.com]
- 15. World Resources Institute — land per facility (40–1,000 acres) vs. permanent employment (<150). Academic / NGO. [wri.org]
- 16. Meta Richland Parish (Louisiana) facility — scale, investment, jobs. Company disclosure / journalism. [siteselection.com]
- 17. Universidad Politécnica de Madrid — industrial land-price inflation (~5×) and manufacturing displacement in Aragon. Academic. [blogs.upm.es]
- 18. Lawrence Berkeley National Laboratory (2024) — US direct water consumption (17.4B gal, 2023); WUE trend; indirect multiplier. Primary, DOE. [eesi.org]
- 19. Operator sustainability reports (Google, Microsoft) — year-on-year absolute water-consumption increases. Company self-report (lowest tier). [policyreview.info]
- 20. Siddik et al. (2021), Environmental Research Letters — 12:1 indirect-to-direct water ratio; US water-use modelling. Academic, peer-reviewed. [vtechworks.lib.vt.edu]
- 21. Richter et al. — presumptive 80%-of-daily-flow environmental-flow standard. Academic. [waterboards.ca.gov]
- 22. Rockström / Steffen et al. — freshwater planetary boundary, assessed transgressed as of 2022. Academic. [nature.com]
- 23. Newsha Ajami — data centers as “permanent crops” requiring continuous water. Expert commentary / journalism. [kunr.org]
- 24. Epidemiological heat-mortality literature — ~2.5% all-cause mortality rise per 1°F heat-wave increment; 9–10% higher nighttime mortality. Academic. [eolios.eu]
- 25. arXiv preprint (March 2026) — satellite LST claim (~2°C, 10 km), subsequently critiqued as non-credible; cited only to mark the evidentiary boundary. Preprint, contested. [forbes.com]
- 26. Engineering first-principles derivation (PUE → thermal rejection); US household electricity averages; NYC consumption comparison. Calculated. [andymasley.com]
- 27. International Energy Agency — global data center electricity (415 TWh 2024 → 945 TWh 2030 base case); waste-heat recovery potential (~300 TWh) vs. actual (<1 TWh). Primary, IGO. [iea.org]
- 28. NVIDIA platform specifications — GB200 NVL72 (120–140 kW/rack); Rubin (250–900 kW/rack projected). Company / industry. [nvidia.com]
- 29. Germany Energieeffizienzgesetz (EnEfG) — 10/15/20% heat-recovery mandate (2026/27/28); PUE ≤ 1.2 for new facilities. Primary, statutory. [ecostandard.org]
- 30. Phoenix climate projection — ~47 days/yr above 110°F by 2050 vs. ~7 in 1990; SRP data center peak-demand share. Government / utility. [news.asu.edu]
- 31. Shelf-sea stratification literature (Celtic Sea, North Sea); GESAMP marine guidance (5–7°C); stratification thresholds. Academic / international guidance. [mccip.org.uk]
- 32. Irish Sea warming (~0.6°C/decade since 1994). Academic / monitoring. [mccip.org.uk]
- 33. Chlorine-biocide toxicity literature — copepod mortality (7.9% calanoid; 21.6% naupliar) at 0.1–0.3 mg/L residual. Academic. [nature.com]
- 34. Microsoft Project Natick — operator thermal claim (unverified); University of Portsmouth EIA call; 2024 termination. Journalism / company. [iotforall.com]
- 35. University of Mary Washington — 25 of 31 Virginia localities under NDAs; Spotsylvania–Amazon confidentiality clause. Academic / journalism. [news.ycombinator.com]
- 36. Uruguay — Article 47 litigation revealing Google Project Teros water use (7.6M L/day) and NO₂ generator emissions. Court documents / journalism. [pmc.ncbi.nlm.nih.gov]
- 37. Virginia JLARC (2024) — statewide data center water consumption +86% since 2019; residential bill-increase projections. Primary, legislative audit. [hls.harvard.edu]
Prepared as a forensic infrastructure analysis for The Layered Grid. The analysis excludes carbon accounting by design, to examine the physical-resource impacts that operate beneath it. This document does not constitute legal, financial, or regulatory advice.
Comments ()